Architecture & engineering firms hire project managers to keep projects on task, on time and within budget. Given the number of activities, deadlines, expenses and other moving parts associated with each project, the data can be overwhelmingly complex for the project manager to assess and communicate succinctly.
One of the simplest but most accurate ways to gain a broad overview of a project’s progress and assess its efficiency is through the use of the S-Curve. Also referred to as a “velocity diagram,” the S-Curve is a mathematical graph that depicts cumulative data, such as man hours, costs and percentage of completion, over a period of time. The graph helps project managers track utilization of resources and identify where projects may be falling behind schedule or over budget.
An interesting use of the S-Curve is the 50/70 rule, which depicts that 70% of a project must be completed in 50% of the time allotted for the project to be completed on time. This rule assumes that 30% will be completed in the remaining 50% of the time.
As demonstrated in Exhibit A, this rule is in contrast to the linear 50/50 rule which assumes that if 50% of the project is accomplished in 50% of the time, the project will finish on time. In reality, this is not likely, and most often, the remaining 50% of time will expire before the project is completed.
Exhibit A. 50/50 Rule vs. 50/70 Rule
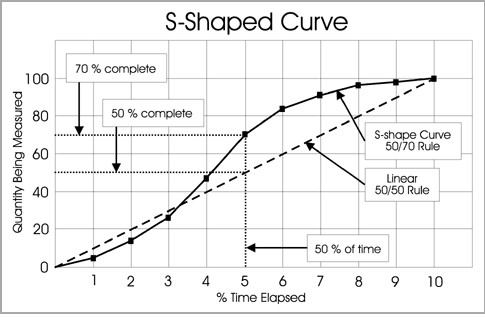
Source: The Neal Whitten Group, nealwhittengroup.com
Elements of the S-Curve
While the factors being measured may vary by project, the element of time is necessary in every S-Curve. The factors that can be plotted against time include a wide range of possibilities, including man hours, costs and percentage of completion.
The data being tracked depends on the purpose for creating the S-Curve in the first place. A man-hour S-Curve, for example, is used to track available resources over time, while the cost S-Curve provides a cash expenditure projection.
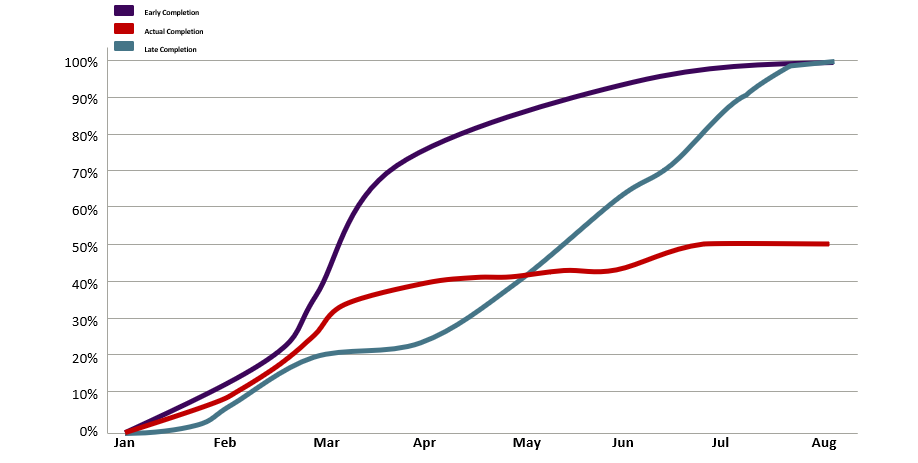
The banana curve is another popular variation of S-Curve. This display contains the earliest time to complete vs. the latest time to complete and compares that data to actual percentage of completion (see Exhibit B). Any excursion of Actual Completion over the Early or Late completion dates should be analyzed. The banana curve is an effective way to identify an at-risk project that will not finish on time.
Exhibit B. Banana Curve
Uses of the S-Curve
The S-Curve can be used for many different project monitoring purposes. One of the most common is Earned Value Management (EVM). The EVM S-Curve starts with the the planned value (PV) that is anticipated for the project, if all goes according to plan, and compares it to the actual cost (AC) and earned value (EV) along the life of the project.
PV is the budgeted cost of work scheduled. It refers to how much the project manager expects to spend for each activity completed, if the projects goes according to plan. AC refers to how much was actually spent on work completed. EV refers to how much the project team expected to pay for work already completed.
An EVM S-Curve is highly effective in measuring project performance, evaluating project health and proactively identifying any warning signs that a project may be going off-track. With the data collected, the project manager can also assess key performance metrics, including:
- Cost Performance Index (CPI) – uses the ratio of EV to AC to measure the cost efficiency of a project (CPI = EV/AC; CPI of greater than 1 indicates that spending is on or under budget)
- Schedule Performance Index (SPI) – uses the ratio of EV to PV to measure schedule efficiency of a project (SPI = EV/PV; SPI of greater than 1 indicates the project is running on or ahead of time)
- Cost Variance (CV) – measures the difference between EV and AC to determine if the project is on budget (CV = EV-AC; CV of greater than zero indicates project is on or under budget)
- Schedule Variance (SV) – measures the difference between planned and earned values (SV = EV-PV; SV of greater than zero indicates spending is at or less than what was expected by a given date)
What Should My S-Curve Look Like?
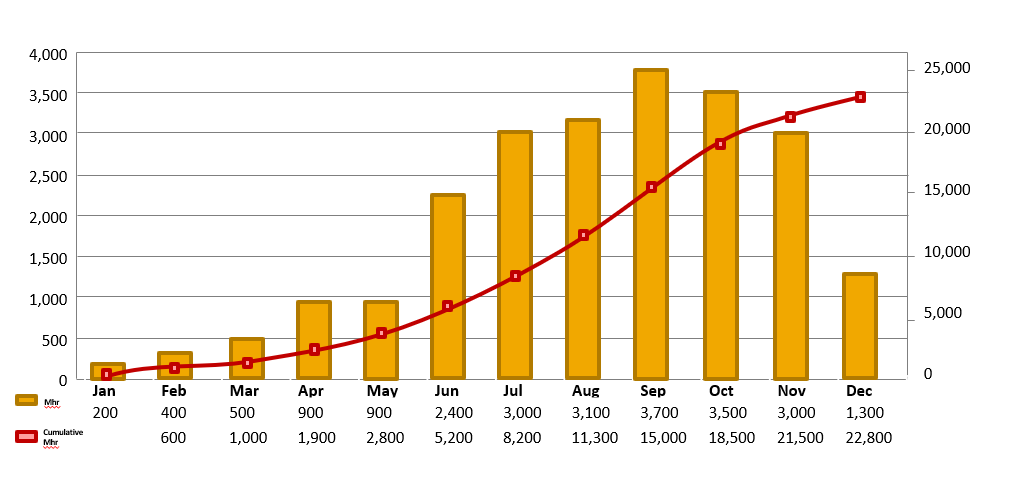
You may be asking, are all S-Curves really in the shape of an S? The answer is: it depends on the project. A typical S curve, as shown in Exhibit C, resembles an S and is considered a back-loaded S-Curve. These are typical projects that get a slower start because of planning and design needs, and most resources are consumed later in the project.
Exhibit C. Back-Loaded S-Curve
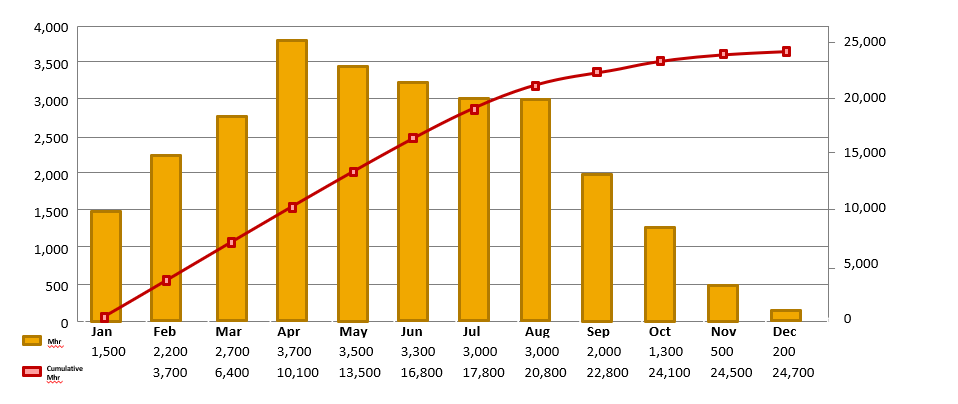
.png) But an S-Curve can also be front-loaded, which represents projects that get a quick start due to factors such as urgent turnaround requirements or repetitive projects that do not require as much planning and preparation. These displays show a steep incline and higher use of resources toward the beginning of the project and flatten out over time (see Exhibit D).
But an S-Curve can also be front-loaded, which represents projects that get a quick start due to factors such as urgent turnaround requirements or repetitive projects that do not require as much planning and preparation. These displays show a steep incline and higher use of resources toward the beginning of the project and flatten out over time (see Exhibit D).
Exhibit D. Front-Loaded S-Curve
.png)
Whatever the shape, type or purpose, S-Curves are a cost-effective, easy-to-use tool to manage risk during design projects and communicate key metrics to your stakeholders. For more information on incorporating S-Curves into your project management procedures, please contact Aaron Rupper or Scott Scarabino of Grassi’s Architecture & Engineering practice.
